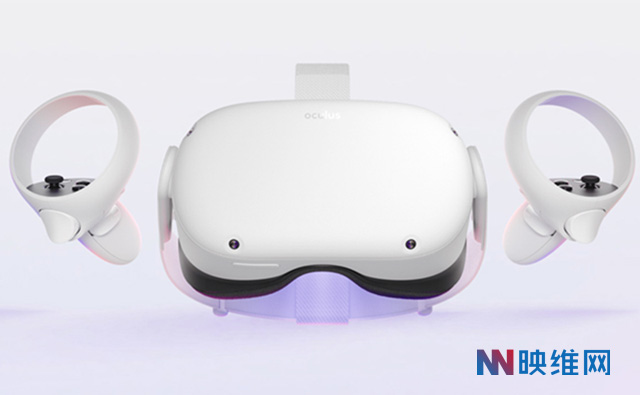
Oculus recently shared a blog post about debugging Unity applications directly on the headset, which is an important step for VR applications. The post introduces the tools needed to debug Unity-based Quest applications, including a method that is currently underutilized: connecting the debugger directly to the headset.
Unity is one of the most commonly used engines on the Oculus Quest platform. The typical development workflow for Unity developers involves connecting the Quest to the PC via Link and enabling Oculus Link, using Unity play in editor to iterate the application, occasionally generating an Android version, disabling Oculus Link, and sideloading the Android version to the Quest.
However, there may be issues that only occur on the headset and cannot be replicated using play in editor, or there may be features that are only available when running on the Quest, such as hand tracking or power management. In these cases, developers can use tools such as RenderDoc for Oculus to analyze GPU issues, Unity Profiler to analyze CPU performance issues, and Perfetto to test the application and obtain system-wide performance data.
The blog post also provides step-by-step instructions on how to enable debugging in Visual Studio 2019 for Unity applications on the Quest headset. It includes setting up the Quest development environment, generating an Android version of the Unity application, installing it on the headset, and attaching the Unity Debugger in Visual Studio. By following these steps, developers can have a debugging experience on the headset that is closer to in-editor debugging.
 Insider
