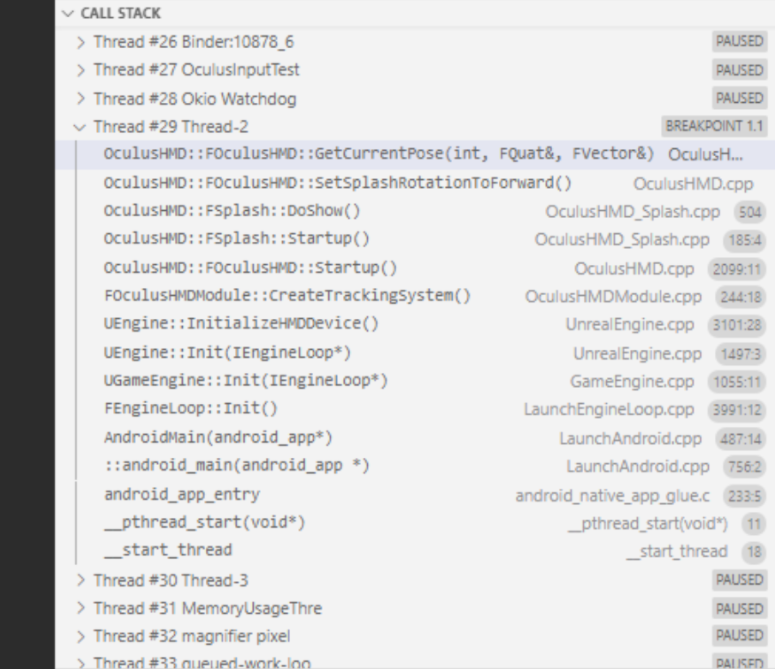
Oculus recently released a VSCode extension called Oculus Debugger, which is used to support Quest and Quest 2 developers in debugging native C/C++ code applications. The Oculus Debugger provides a customized experience seamlessly integrated with the Unreal Engine and C++ projects, helping developers identify, diagnose, and solve issues in their code. The extension can be downloaded and installed from the Visual Studio Marketplace. The tool offers features such as viewing running threads and corresponding stack traces, highlighting the currently executed source code line in the editor, pausing, stepping in and out, and continuing execution, as well as inspecting and adding variables to the watchlist. To use the Oculus Debugger, developers need to install Visual Studio Code, search for the extension in the Extension tab, and install it. For further instructions on debugging Oculus projects and integrating with UE4, developers can refer to the provided documentation. Oculus welcomes feedback and will continue to assist developers in building high-quality Quest applications.

 Insider